Reading Anchor
OpenStax Astronomy 2e, Chapter 5.1-5.5 on light, spectra, atoms, blackbody radiation, and Doppler shifts. The local textbook reference is stored at references/openstax-astronomy-2e.pdf. These notes use the textbook for scope and terminology while presenting original explanations and examples.
Lecture Arc
Almost everything we know about distant objects arrives as light. Spectra transform light from a picture into a physical measurement of temperature, composition, and motion.
The lecture should begin by asking students what can be observed directly. Only after that should the explanatory model be introduced. This helps students distinguish evidence from interpretation, a distinction that becomes essential when the course moves from the night sky to stars, galaxies, and cosmology.
Terms Developed in Context
These terms form a connected reasoning system for the lecture. Each entry extends the concise slide panel by showing how the term is used, what it is linked to observationally or mathematically, and where its interpretation can fail.
- wavelength
The spatial distance over which a wave's pattern repeats. Astronomical wavelength selects which physical processes, temperatures, and materials a detector can reveal. In vacuum, wavelength and frequency satisfy \(c=\lambda\nu\); photon energy is inversely proportional to wavelength.
In context: Shorter-wavelength photons carry more energy. Earth's atmosphere transmits some bands and blocks others, which is why observatory location depends on wavelength. Boundary: Color names cover broad bands, and measured wavelength can be shifted by source motion or cosmic expansion.
- frequency
The number of wave cycles passing a point per unit time. Frequency is directly linked to photon energy and provides an alternative coordinate for spectra. It increases as wavelength decreases in vacuum, and \(E=h\nu\).
In context: Frequency remains constant when light crosses a stationary boundary while speed and wavelength may change. Astronomers commonly switch between frequency, wavelength, and energy units depending on the band. Boundary: Wavelength and frequency axes run in opposite directions, so spectral trends must be read carefully.
- photon
A quantum of electromagnetic radiation carrying energy and momentum. Detectors ultimately count or convert photons, so astronomical evidence is limited by photon statistics. Photon energy is \(E=h\nu=hc/\lambda\), linking quantum detections to spectral wavelength.
In context: A bright source delivers more photons per unit area and time, while a hotter spectrum shifts the energy distribution. Shot noise scales roughly as the square root of detected photon number. Boundary: A photon is not a tiny colored pellet following a classical trajectory; quantum behavior depends on the measurement.
- blackbody
An ideal absorber and emitter whose thermal spectrum depends only on temperature. It provides the baseline model for interpreting stellar continua and planetary thermal emission. Wien's law links peak wavelength to temperature, while Stefan-Boltzmann links emitted flux to \(T^4\).
In context: Stars approximate blackbodies in their continua but their spectral lines carry composition and atmospheric-structure information. A fitted color temperature can differ from a physical temperature if the source is not thermal. Boundary: Real spectra contain absorption, emission, opacity effects, and geometric complications.
- emission line
A narrow spectral feature where intensity exceeds the surrounding continuum because atoms, ions, or molecules emit at particular transitions. Emission lines identify material and diagnose temperature, density, ionization, and motion. The line wavelength reflects an energy-level difference; Doppler shifts move the observed wavelength.
In context: Hot low-density gas viewed against a darker background often produces an emission spectrum. Line ratios can be more informative than a single line because they constrain physical conditions. Boundary: A line's strength is not a simple abundance meter because excitation, opacity, and geometry also matter.
- absorption line
A narrow reduction in intensity where intervening material removes photons at specific transition wavelengths. Stellar absorption lines reveal atmospheric composition, temperature class, pressure, and radial motion. They occur when cooler gas lies in front of a brighter continuous source and share transition wavelengths with corresponding emission lines.
In context: The pattern of many absorption lines, not one feature in isolation, supports classification. Instrument response and Earth's atmosphere must be calibrated before interpreting line depth. Boundary: A missing or weak line does not prove an element is absent; the atoms may be in the wrong excitation or ionization state.
- Doppler shift
A change in observed wavelength or frequency caused by relative line-of-sight motion between source and observer. It measures radial velocity in stars, gas clouds, galaxies, and exoplanet-host systems. At speeds much less than light, \(\Delta\lambda/\lambda_0\approx v_r/c\).
In context: A redshift corresponds to recession and a blueshift to approach under the usual convention. Calibration requires comparing observed line centers with laboratory rest wavelengths. Boundary: It measures only the line-of-sight component, and cosmological redshift requires a broader expansion model at large distances.
Evidence Table
| # | Evidence or observation | How students should interrogate it |
|---|---|---|
| 1 | Hot dense objects produce continuous spectra whose peak color depends on temperature. | What measurement, image, spectrum, or sky observation would support this? |
| 2 | Thin gases emit or absorb light at characteristic wavelengths. | What measurement, image, spectrum, or sky observation would support this? |
| 3 | Shifted spectral lines reveal radial motion. | What measurement, image, spectrum, or sky observation would support this? |
Model Development
The model for this lecture has three linked parts:
- Light behaves as both wave and photon depending on the measurement.
- Atoms have quantized energy levels, producing diagnostic line spectra.
- A spectrum must be calibrated before line position or intensity can be trusted.
The instructor should emphasize where the model is a simplification. Introductory astronomy often works by adopting a useful first model, identifying its assumptions, and then refining it when new evidence demands more detail.
Quantitative Reasoning
This equation or proportionality is not just a formula to memorize. It is a compact statement of a physical or geometric relationship. A strong student solution defines each symbol, states the unit system, identifies the assumptions, and interprets the result in words.
Worked Example
- A line with rest wavelength 656.3 nm observed at 657.0 nm is redshifted.
- The fractional shift is 0.7/656.3, about 0.00107.
- The radial speed is therefore about 320 km/s away from the observer.
After completing the calculation, students should ask whether the result is plausible. A numerical answer without a reasonableness check is not yet a scientific conclusion.
Visual Interpretation
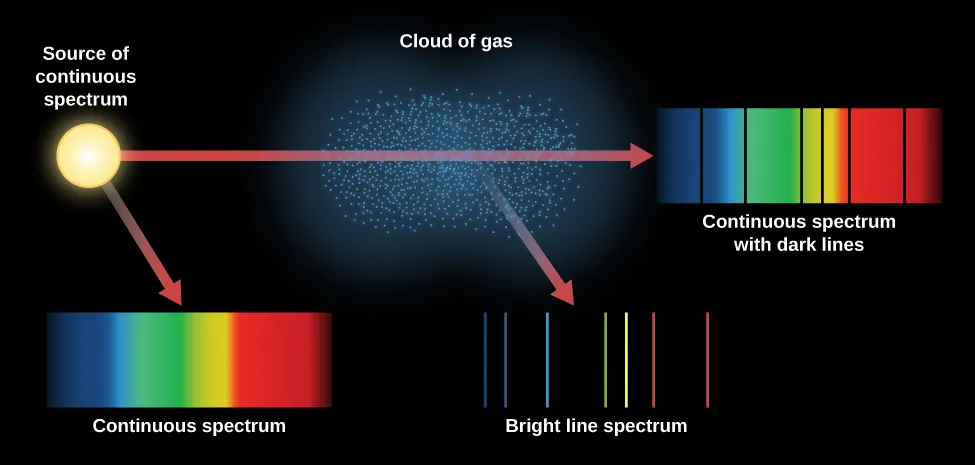
Continuous, absorption, and emission spectra depend on source geometry and gas excitation. Credit: OpenStax Astronomy 2e, Fig. 5.21, CC BY-NC-SA 4.0.
Misconception and Boundary Condition
The correction should not be presented as a slogan. It should be tied to the evidence and model from this lecture. Students should practice saying what would be different if the misconception were true.
Active Learning Plan
Students classify three spectra as continuous, emission, or absorption and state what physical situation could produce each.
A suggested timing is 2 minutes individual prediction, 3 minutes peer comparison, and 3 minutes whole-class synthesis. The point is to make students commit to a model before seeing the instructor's full explanation.
Lab or Observing Connection
Lab 04 uses spectra to infer composition and motion with explicit uncertainty.
Students should see the lab as a continuation of lecture reasoning. The lab does not merely demonstrate a concept; it asks students to collect, interpret, or critique evidence with uncertainty.
Synthesis and Study Questions
Spectroscopy is astronomy's remote laboratory: it links photons to matter, motion, and physical conditions.
- What was the central observation or evidence pattern?
- What model explains it, and what assumptions does the model make?
- Where did quantitative reasoning constrain the claim?
- What uncertainty, limitation, or misconception remains important?
References
- OpenStax, Astronomy 2e: OpenStax Astronomy 2e, Chapter 5.1-5.5 on light, spectra, atoms, blackbody radiation, and Doppler shifts.
- Course reference log:
../reference-log.md.